
EINK STARTER MONITOR
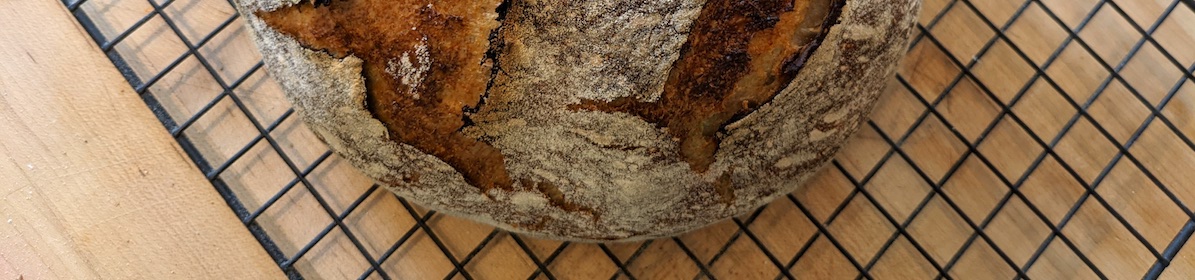
Here’s a jar that knows about its contents. It’s made for fermenting stuff like sourdough, tepache, and hot sauce. Its e-ink screen displays the last three hours of co2 production and rise-in-jar, and it sends co2, temperature, humidity, and height over MQTT to a Mycodo database/UI instance.
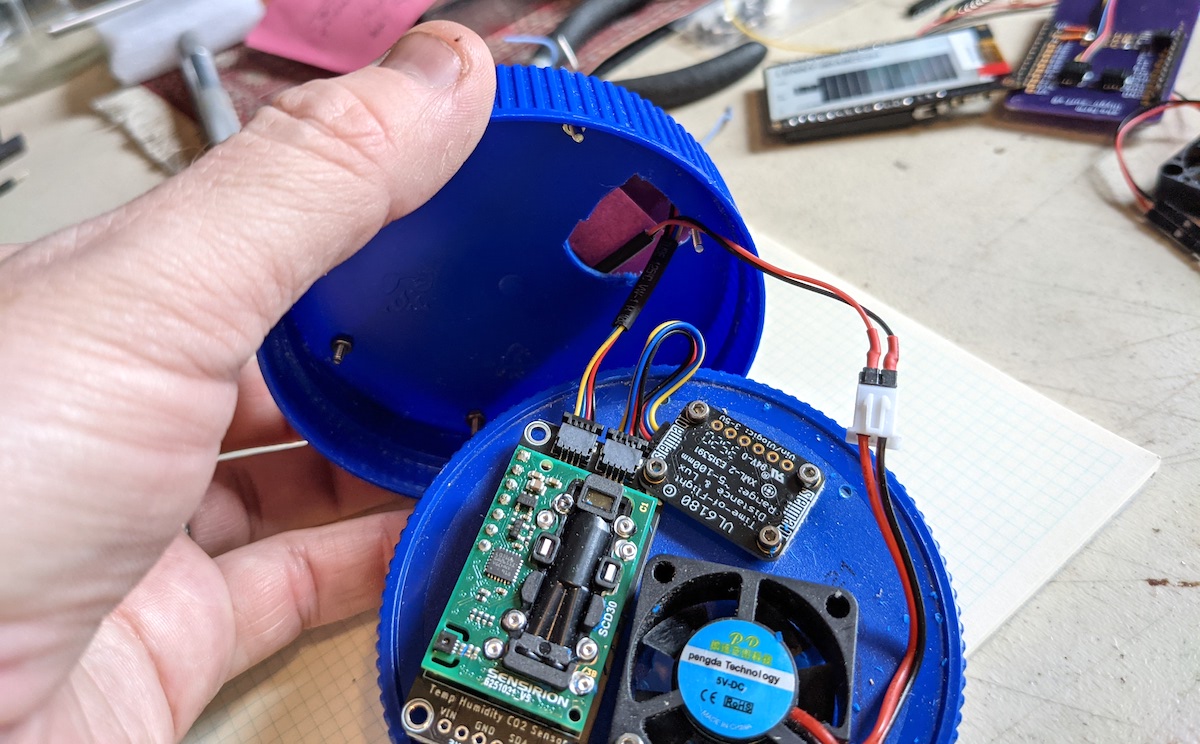
It’s a retrofitted peanut butter jar - the tops are easy to machine, they’re easy to wash, and emptying them is delicious. I also didn’t want a metal lid interfering with any radio stuff we might want to do. I used to use a wider container for my starter but I changed in order to test out if co2 sensing or height sensing would be more effective a gauge of starter activity (my original container was too wide for a height sensor to measure any meaningful change). (By the way, I know about Breadwinner - in fact, I have been helping them as they make their jar - this one is completely separate. It’s designed how I wanted it to be, based off the last 2 years I’ve spent instrumenting my sourdough starter and my own opinions about how it should look/act.).
INITIAL SETUP - UGLY TUBS
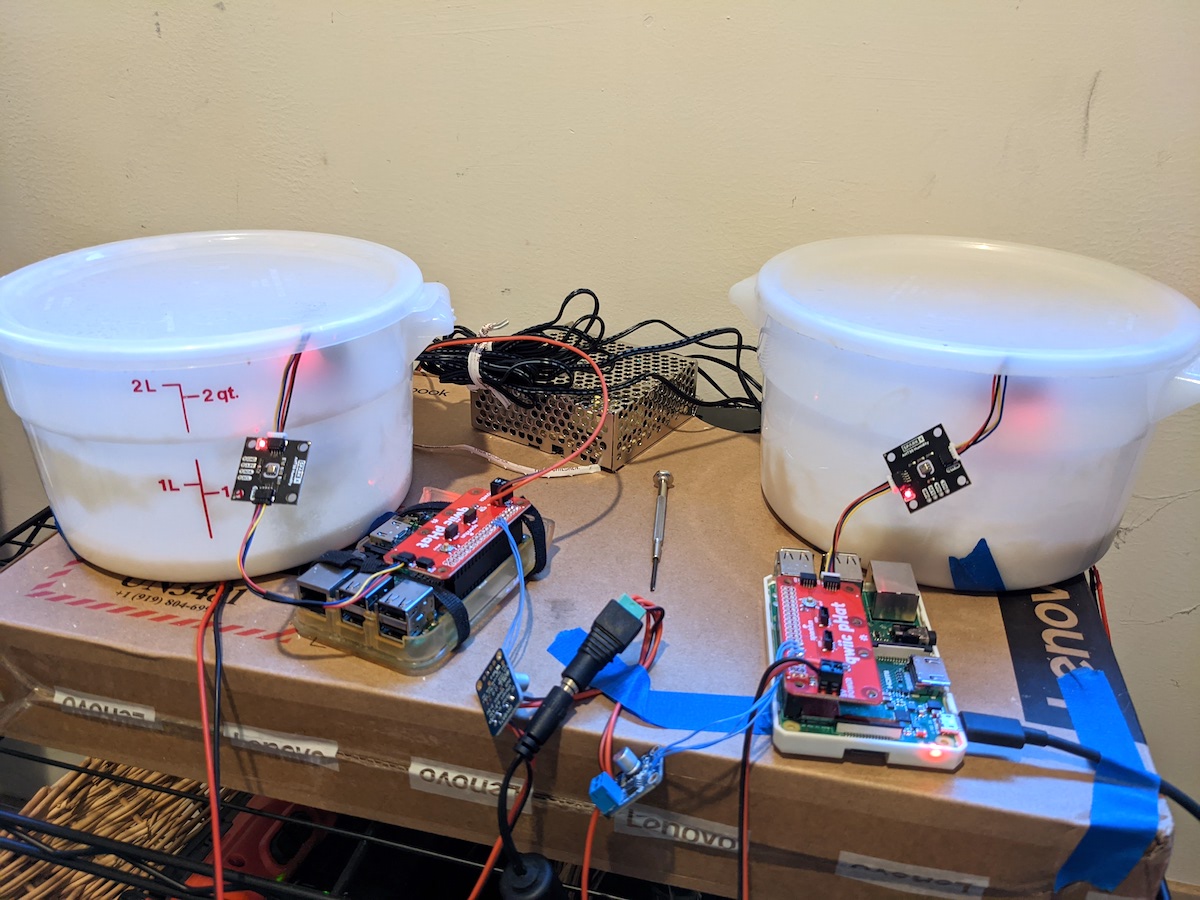
I was using a Raspberry Pi with a SGP30 MOX sensor, which approximates environmental co2 levels, leading to all sorts of problems with sensitivity and consistency. The software was initially a python script that posted to an InfluxDB instance running locally, connected to a Grafana UI. (I used this excellent guide to get those systems up and running but read on, the Mycodo software is more straightforward).
In the photo above, I’m trying closed-loop control with a resistive heating pad to warm the starter from below, to maintain a constant temperature. This did not work at all, because the starter doesn’t circulate and heat evenly - instead, you basically cook a little crumpet at the bottom of the starter, and the rest of it spoils. (In a later post about my zero-g fermentation work, you’ll see how we can get around this problem).
The problem was that the “environmental co2” sensor would peg to its maximum value as soon as any fermentation started. It was certainly responsive, but it wasn’t expressive enough: I had made a “detctor” instead of an observer. I needed more dynamic range, so I later added a small venting system that uses a fan to draw jar-air past the sensor at a consistent rate. Also, using a real NDIR sensor has made a big difference in consistency and dynamic range.
CURRENT DESIGN - MAKING IT A FIRST-CLASS OBJECT
One thing with my initial setup that felt consistently wrong was that I had the container in my kitchen, but I’d have to go to my computer-room to check how it was actually doing. I decided the jar needed a display right on it, so that it would work as a first class object-in-the-room, rather than requiring that I interact through screen and IRL. Around this time I had ordered a couple of promising-looking eink displays with integrated ESP32, LiPo charging, SD card, and some other nice features. They took forever to arrive, but they delivered on their promises - a second order yielded slightly different hardware, but in a nice way - no onboard LEDs (much better battery life), and better silkscreen.
(I had also ordered two MagTags to try on this idea, but gave up working with them because they have terrible WiFi performance, and the graphics library is opaque and contrived - I dare you to read the docs and tell me how to draw a straight line). Sad face - I guess I will try to find a way to connect them to my mushroom-incubation system, since that lives right beside the router. They have some other nice features, like a speaker and some side-firing neopixels…
The code on the ESP32 is a mess - I really hate writing wifi flows so most of the captive-portal and wifi-association stuff is just defaults from the (excellent so far) ESPAsync_WiFiManager and AsyncMqttClient examples. LILYGO, the e-ink vendor, makes it pretty easy to find the right graphics library at their GitHub site.
It works OK but is not beautiful, or even clean. But here is the repo.
DISPLAY
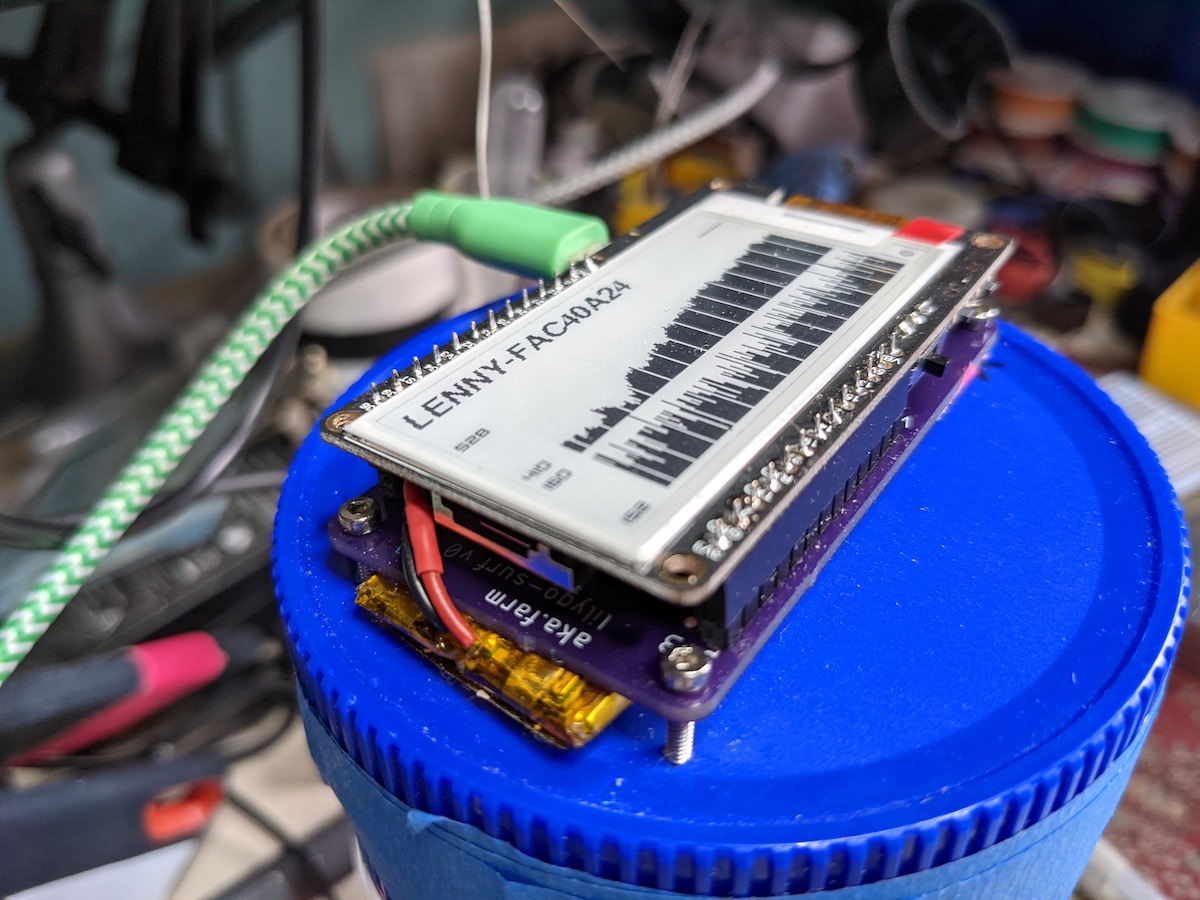
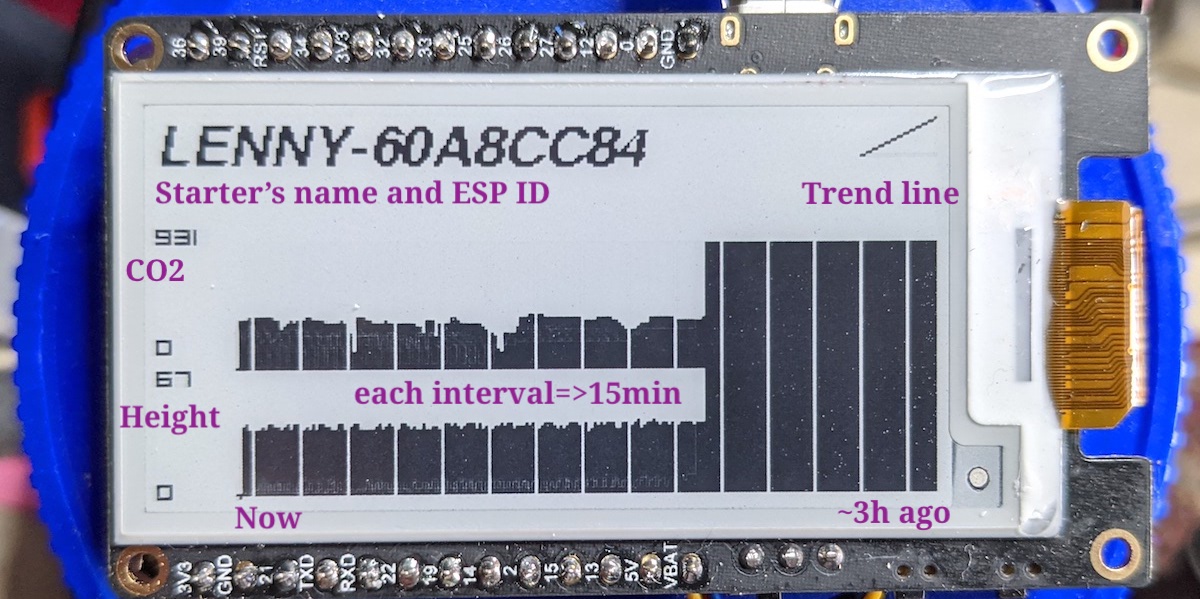
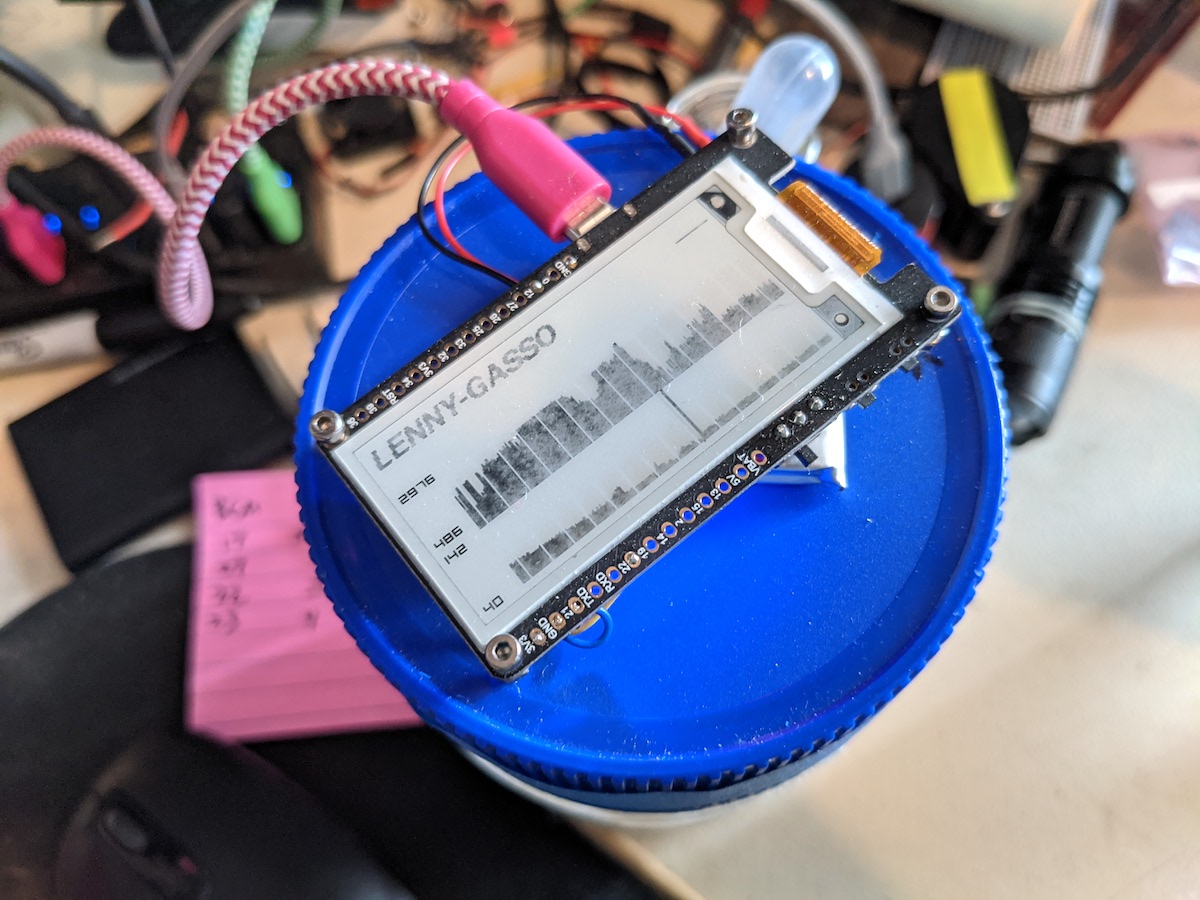
I spent quite some time designing the screen, and I’m mostly pleased with how it works now. I usually shy away from graphic design, but when the pixels are so scarce it becomes a different kind of problem, one I’m better at approaching. Here’s my initial plan/sketch for the display (my sourdough starter is Lenny, from the Simpsons), and the display as it is now:
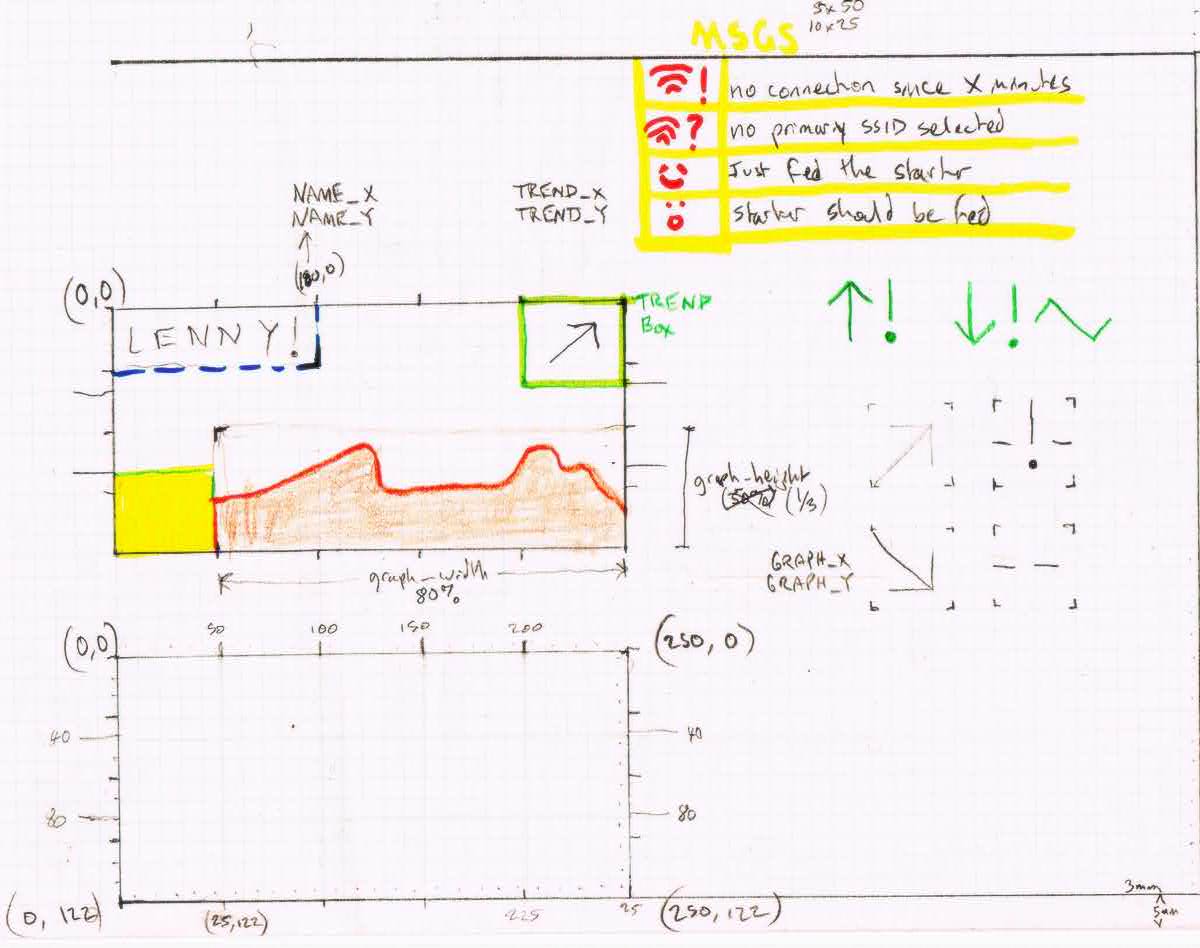
Some details:
- The TREND area (upper-right of display) is for an arrow showing a line whose slope is the same as the rate of change of the co2 concentration. I added this to help build my intuition around the starter’s behavior after a feeding and in different weather conditions. I like this more than a trinary “increasing/decreasing/unchanged” icon because it encodes more information into the same space, but I need to spend more time making the line stand out and be readable from afar.
- The current code actually shows two timeseries, so I can directly compare their observations (ie, starter height vs starter co2 production).
- Each timeseries is scaled so it uses the full height available in the display. I’m not sure I will keep this, as I think that ultimately a static scale will help the user compare performance across many days/weeks: recognizing the first hour of a familiar graph shape is easier if the y-axis scale does not change dynamically. (But having the graphs guaranteed to reach MAX_Y makes them look cooler and like more is happening).
- I added Y-axis values but not X-axis values; instead, I tried to use a relatively intuitive/natural x-axis mapping, one pixel is one minute. I also break up the graph by drawing a blank line every 15 minutes, so you can easily count up to bigger time intervals. On the Y-axis, the values are dyanmic, and I’m not happy with the font’s readability; I’ll look for a better approach here once I determine if I’ll keep the 2-up graph view.
- I need to find a way to label the type of data in each graph - maybe a static label off-device (ie, written on the jar lid) is the best idea here, I don’t know.
- I add the last few hex digits of
ESP_getChipIdto the starter name; this helps me test because it means I can flash the same code to all devices. (Their MQTTclientIDis also made out of this ID) - This display is missing one more kind of information: signals from whatever server might be listening; you can see on the initial layout I have some icons for that field, which will be between the NAME and the TREND areas at the top of the screen. Another icon not mentioned in the notes would be something to either tell you the starter is IDEAL for pitching, or something reminding you that it is time for a feeding.
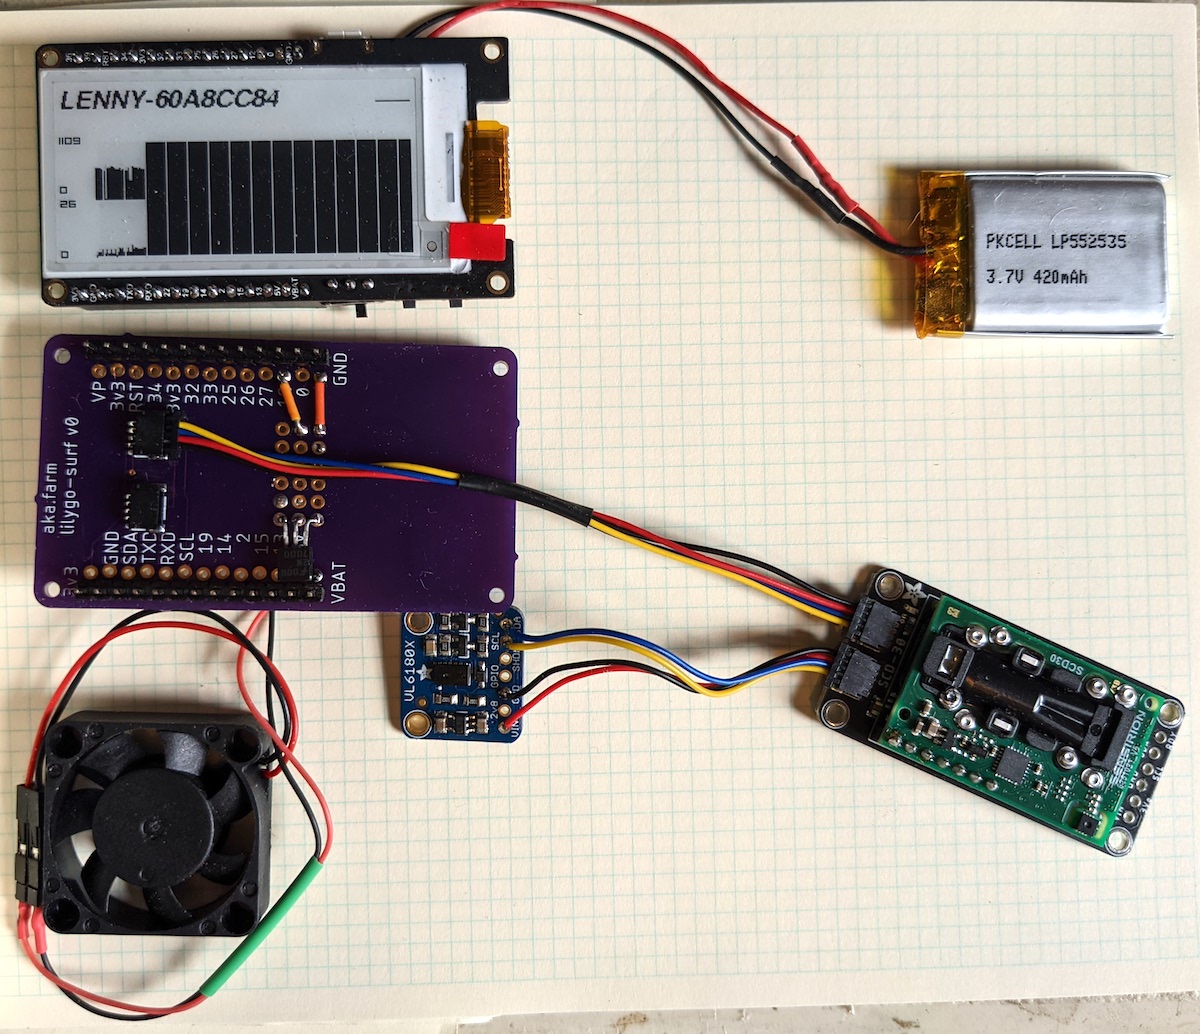
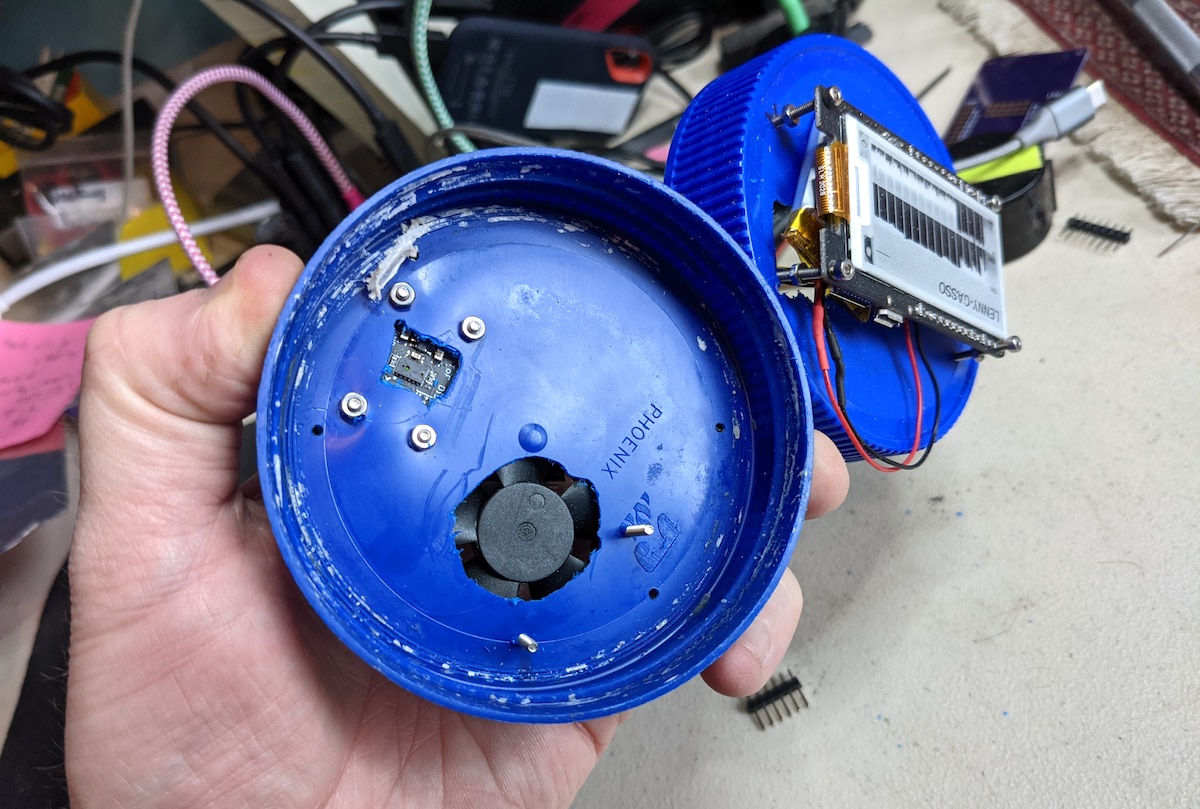
PCB
I like these e-ink modules, so it seemed worthwhile to make a little surfboard to make working with them easier. I almost always mess up the first spin-up of any PCB I design, so I kept this very simple:
- 2 Qwiic receptacles (I love this format, nice work Sparkfun!)
- Small bradboard area with three rows of vertically-connected 0.1-spaced vias (I knew I’d be adding a basic N-channel MOSFET, but didn’t want to get bogged down arranging a whole mini-breadboard with rails, although this is a good idea for a 2nd rev)
- All existing pins broken out and labelled (next time I’ll put pin labels on both sides)
- All mounting holes carried over from the LILYGO board (I messed this up, but the PCB’s mounting holes are still perfectly usable)
…for what it’s worth, the board works great and has no errors other than slightly misaligned holes! Here’s the link to the files on OSHPark.
BOM
- LILYGO EINK module
- Adafruit Qwiic SCD30
- Adafruit VL6180
- 2N7000 N-Channel MOSFET
- 420mAh LiPo
- One PCB (see above)
- 2x Qwiic connectors, and any headers you choose to use to connect PCB to module.
- wee tiny Fan (this or any equivalent, smaller the better)
- M2 screws, 12 to 20mm long, and nuts
- Peanut butter container and 2 lids
SERVER-SIDE
A big part of having a display on the device is that the bulk of my interactions with the lid can start and end there. However, it’s a wifi device, so we might as well have it log the data somewhere so I can see longer-term trends.
I’ve been having a great time using Mycodo for closed-loop control of fermentation and incubation systems (I’ll have a post coming up here soon about the zero-g fermentation work I’m doing with MIT), so it was easy to find a spare Raspberry Pi Zero W and set up a simple 2-jar MQTT display:
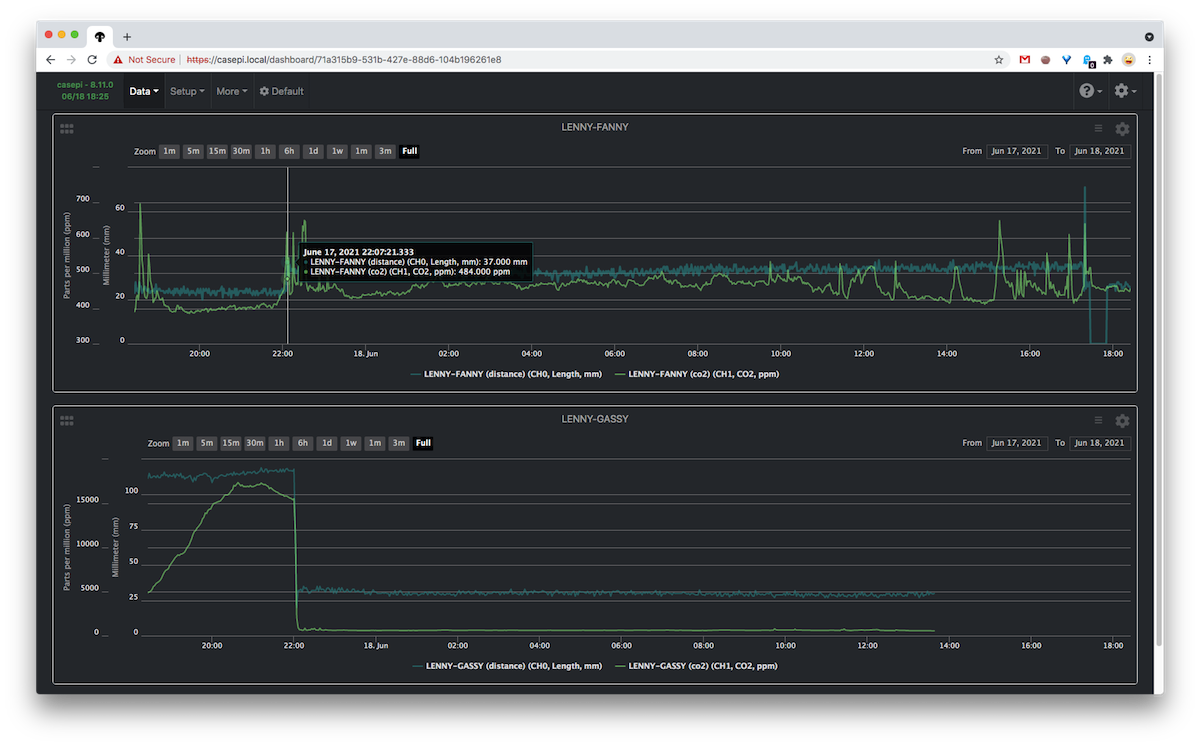
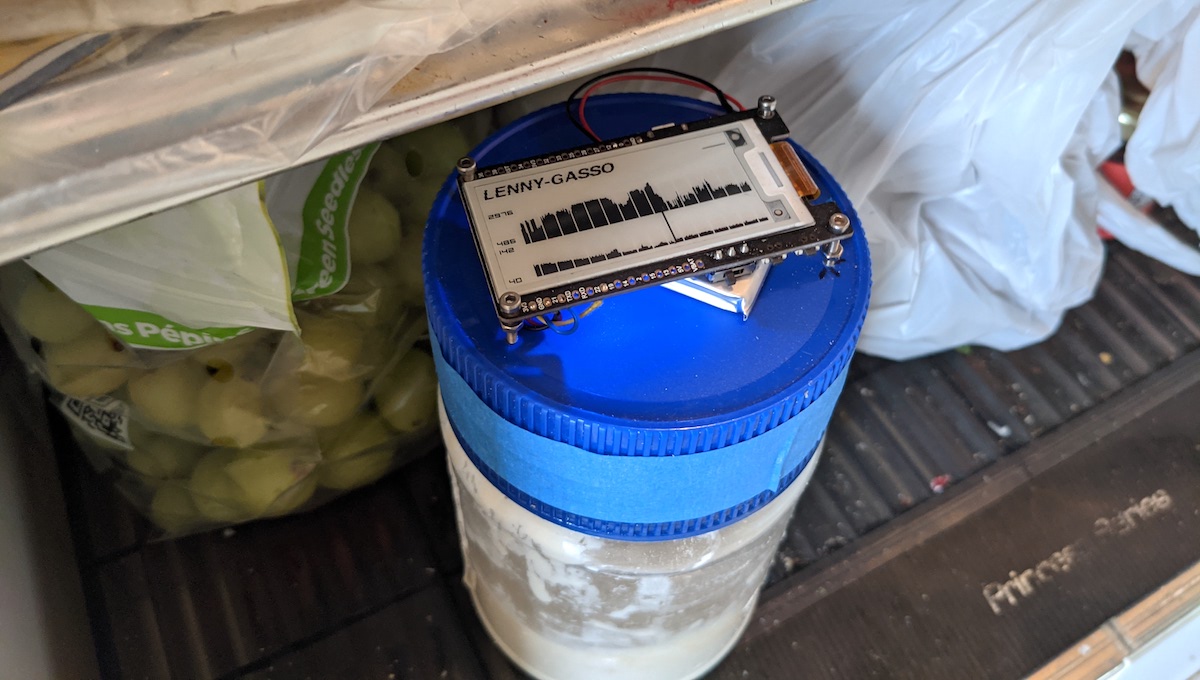
I’m kind of pleased with a little touch I put in the code - since we get temperature for free alongside each co2 reading, we can use it to tell if we’ve been put in the fridge; and if we are, stop trying to use the WiFi radio since it’s likely futile. I haven’t measured this yet (I still actually have a tiny hope I can get some wifi out of the fridge), but it’s likely to substantially improve battery life for a device that will live in the fridge most of the time (only being taken out for feedings and baking).
SO HOW IT IS GOING
I am a little surprised how noisy my height sensors are reading; I may have to add some smoothing or take a page from Breadwinner’s approach and express height as a multiple of some initial starting condition (might it even be worth having a static line on the side of the jar indicating “fill with starter to this line”?).
The NDIR CO2 sensor is working very well, and may not need a fan at all. I’d still like to test it for over a month and make sure it’ll be robust enough to keep using; other pitot-sampling techniques use a dessicant in the sensing-chamber, and potentially other kinds of weatherproofing will be needed.
Battery life, as always, was in my mind when I wrote the initial code stubs, but I haven’t done a pass to really optimize that; I know there’s a deepSleep ESP mode that is relatively well-exposed, I just need to look into it. I hate dealing with wifi so much that I think I’m first just going to make brutal deepSleep optimizations and then just see if that killed my wifi performance. Another battery-life consideration is writes to the display: I’ve noticed that it’s possible to put the display into an uncool state after powerdown, in which static or temperature seems to randomly affect the visibility of some pixels that were supposed to have been left “on,” ie dark. Right now the battery lasts about 6 hours, obviously totally unacceptable.
In general, it has been interesting to see the metabolic changes in my starter more clearly, and to see them impacted by the local environment - it is definitely augmenting my intuition as I try to become a better baker. But it’s not essential - this is the kind of device that, if it does its job perfectly, will eventually stop being needed by its user. I like having this around as augmentation, but it will never be as easy or fluent as simply taking the time to learn to understand what’s happening (or alternately, embrace the chaos).
IN THE FUTURE
I’d like to add some functionality to the one button the LILYGO breaks out. I’ve procrastinated on this because the correct thing to do, I believe, is to have a longpress signal to the server that a feeding occurred, and a shortpress cycle the timeseries (ie, you can have the only timeseries on screen show any one of the four sensor readings, height, co2, temperature, and humidity). Another option would be for shortpress to cycle through different entire screen layouts: a screen showing each of the four sensor types in a single big timeseries, a screen showing all four at once, a screen showing wifi diagnostics, a screen showing a countdown until we need to feed again, etc.
If it turns out that the lid is able to be relatively predictive of starter performance (either through an off-device model of bread behavior, like Breadwinner, or through a simple peak-detector that lives onboard), it’d be neat to introduce another way for the device to signal you it was getting ready to use.
A long time ago, I helped design the audio-mark for a smart pill bottle that would alert you when it was nearing time to take your prescription; we ended up with a cool interaction model that tried to strike a balance between authoritative, like a smoke alarm (“take your medicine NOW and I’ll stop beeping”) and passive, like a candle that burns out on its own (if you watch it you see its signal, but it’s on you to watch it). About an hour before you were due to take your prescription, it would start to play Marco Polo with itself: it would emit a soft call-and response tone pair, with the time between calls steadily decreasing from 5 minutes between calls (at one hour before prescription-time) to a continuous song (at the time itself, if you hadn’t already taken the pills and thus reset the timer). Implementing the same behavior on this module would be pretty straightforward, but I’m loath to add a speaker, etc to the BOM for now.
Of course, there’s plenty to improve on right now, without adding anything to the BOM or adding any new features: the wifi setup code is more or less unexamined (but it does work, hooray), and the loop() could be much cleaner/sparer just by using a couple of elapsedMillis instances. I did some initial reading on this to make sure there are no ESP32 gotchas (it seems there may be one or two), but this (general loop cleanup) and implementing simple button functionality are high on the list for next steps. There’s also a chance I’ll be able to interface this with my Breadwinner account, which would be cool because I bet they have some cool data-analysis in store (sign up here! I bet their v2 jar will be even cooler!); I’d love to contribute my starter data to a larger (open) corpus of cultures like these…